What GSD do you need to detect pavement cracking from satellite imagery?
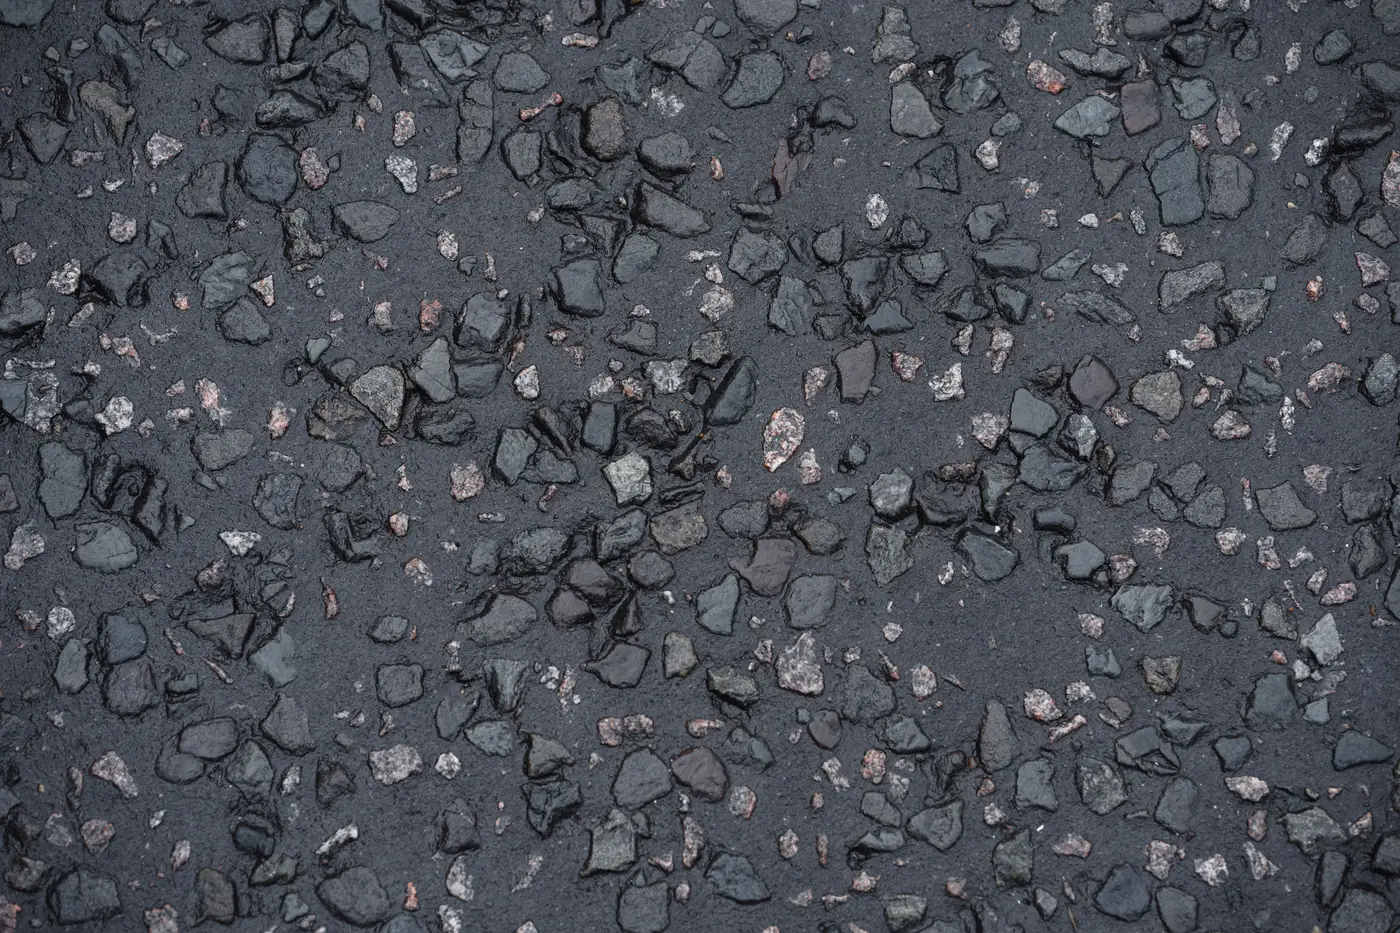
If you've sat through a budget meeting where someone asks "can't we just use satellite imagery instead of driving the network every year," the answer hinges on one number: ground sample distance. GSD is the size of the ground area one pixel covers. A 1 m GSD image means every pixel is averaging a 1 m by 1 m patch of pavement into a single color value. A hairline crack is a few millimeters wide. Do the math and you'll see why resolution is the whole ballgame here.
For pavement distress work, you want GSD at 0.3 m or finer. That's the line where cracking, ravelling and patching start showing up as distinguishable texture in the imagery rather than noise. Above that, roughly 0.5 m to 1 m, you can still pick out gross features like a failed shoulder or a patch job that's lifted, but fine cracking blurs into the surrounding pixels and disappears.
Why 0.3 m is the practical floor, not a nice-to-have
A single crack won't ever be "resolved" the way a property line is on a survey plat. No commercial satellite or aerial sensor gets fine enough to trace one crack edge to edge. What 0.3 m buys you is something different and, for a resurfacing program, more useful: it's fine enough that a cluster of alligator cracking reads as a distinct texture pattern against sound pavement, and that pattern is consistent enough from segment to segment to classify.
Think of it the way you'd think of a windshield survey from a slow-moving vehicle versus a flyover at 10,000 feet. Neither one measures individual crack widths with calipers. Both are reading pattern and density and converting that into a condition call. VHR imagery at 0.3 m or finer does the same job from overhead, consistently, across the whole network instead of whatever a rating crew's route happened to cover before the shutdown.
Coarser imagery, the kind that's cheap and easy to pull from a general-purpose satellite archive, just doesn't have the texture resolution for this. You'll see major rutting or a washout. You won't see the early-stage fatigue cracking that tells you a section is two seasons from needing a mill-and-overlay instead of a crack seal.
RGB is enough for this, no specialized sensor required
Pavement distress detection at 0.3 m runs on standard RGB imagery, the same three-band color data you'd get off any VHR satellite or aerial platform. No multispectral bands, no LiDAR return. The pixel footprint on the ground is doing the work. That keeps acquisition simple: an annual VHR pass, RGB, 0.3 m or finer, off the same kind of platform already flying general-purpose aerial and satellite mapping missions.
What this means for an annual resurfacing cycle
Pavement management shops build a prioritized list once a year ahead of budget season, and the question driving that list is which segments have gotten worse since last cycle and by how much. For that cadence, one VHR pass a year at 0.3 m or finer gives you a defensible, network-wide condition read instead of a sample. You're not extrapolating from the arterials you happened to drive to the collector streets nobody got to.
That's the gap Road Surface Condition is built around: an annual VHR pass over the whole network, classified by segment for where cracking, ravelling and patching are concentrated, turned into a ranked list before the budget conversation starts rather than after a crew has driven every lane mile by hand.
If you're scoping next year's resurfacing program and want to see what a full-network read looks like before committing a rating crew's calendar to it, that's the conversation worth having now.